Top 11 Customer Engagement Metrics To Measure

Table of contents
With just a few taps on their phone, customers can quickly compare product prices, check reviews, and easily switch brands. So, how does one earn a customer’s loyalty? The secret is tracking your customer engagement.
But evaluating your customer engagement isn’t just about looking at the sales figures. Sure, metrics like sales and profits are important, but they don’t give you a complete picture. To understand more, you need to dig into how your customers are actually interacting with your brand.
Are they talking about you on social media? Are they coming back for more, or are they quietly slipping away? And if they are, what is making them switch brands? Tracking these actions can tell you a lot about what your customers feel about your brand.
And, how do you track these behaviors? By measuring customer engagement metrics. In this article, I give you the top customer engagement metrics that matter the most today. These metrics will help you understand how your customers perceive your brand—and how you can keep them engaged.
Table of Contents
- Why Measuring Customer Engagement Metrics Matters?
- Top 11 Customer Engagement Metrics To Track
- Improve Customer Engagement By Tracking The Right Metrics
- Frequently Asked Questions (FAQs)
Why Measuring Customer Engagement Metrics Matters?
First, let me quickly walk you through what customer engagement really means.
Customer engagement is all about building a strong connection between your business and your customers. It goes beyond just making a sale—it’s about creating meaningful interactions that make customers feel valued and understood.
Engagement can happen in many ways. For instance, a customer can leave a positive review, participate in one of your social media challenges, open your emails, or even just spend more time browsing your website.
The important thing is that these interactions show a deeper level of interest and involvement with your brand. This is something every business should strive for because engaged customers are more likely to stick around.
Now, coming to the important part – Why does measuring customer engagement matter? because simply guessing how engaged your customers are just won’t cut it. You’d need numbers and metrics to understand your customer engagement.
Here’s a list of benefits of measuring customer engagement:
- Gain insights into customer behavior: By analyzing customer engagement, you get a clear picture of how your customers interact with your brand. Do they engage more on social media, or do they enjoy reading your blog? Once get these insights, you can customize your marketing tactics to meet them where they are.
- Improve customer satisfaction: Engaged customers tend to be happier. By monitoring engagement, you can pinpoint successful and unsuccessful strategies. This understanding enables you to make adjustments that enhance customer satisfaction.
- Boost retention rates: While gaining new customers is important, maintaining existing ones is even more beneficial. Tracking those engagement metrics will help you recognize which customers may potentially churn and the reasons behind it. This way, you can be proactive in winning those customers back.
- Drive revenue: Customer engagement is closely tied to revenue. Customers who are engaged are likely to spend more money on your brand, recommend more friends, and make repeat purchases.
Top 11 Customer Engagement Metrics To Track
Now, let’s get straight into the important metrics you should be tracking. Each one of these will provide you with a distinct perspective on the ways your customers are engaging with your brand.
These metrics will give you a comprehensive understanding of what’s working, what’s not, and which areas need improvement.
1. Website traffic
If you own a business, chances are that you have an official website through which you sell your products or services to your customers. So, the very first thing to analyze is your website traffic to check how many customers visit your website.
So how do you define website traffic?
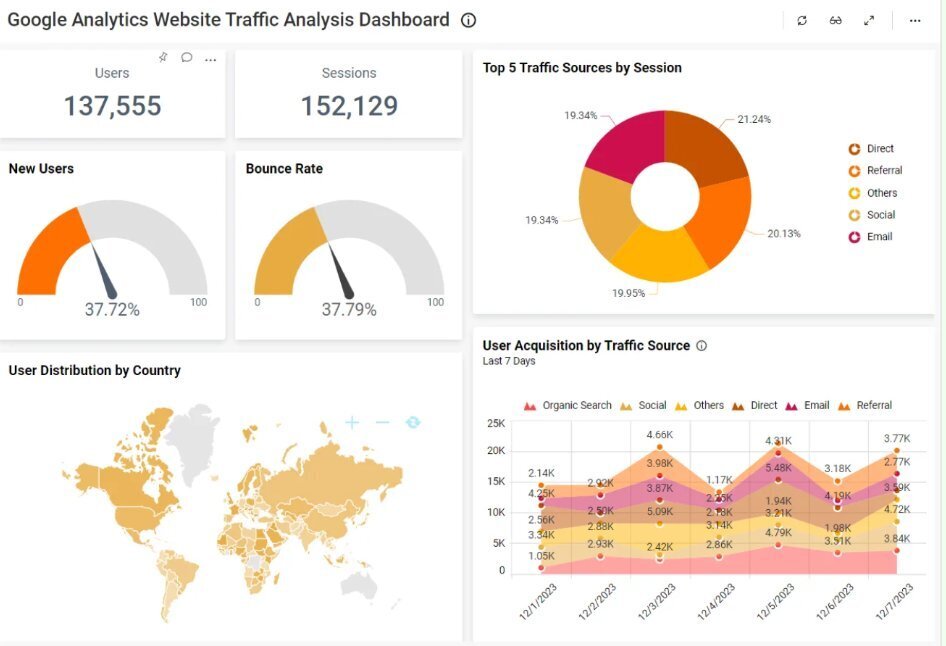
Website traffic is a crucial customer engagement metric that refers to the volume of users who visit your website. This can be tracked daily, monthly or even quarterly – according to your business needs.
Website traffic can also be segmented across various channels:
- Organic traffic: This shows the number of visitors who come to your website from search engine results
- Direct traffic: Shows the number of visitors who come to your site by typing your URL directly into their browser.
- Referral traffic: Shows the number of users who come to your site from other websites via hyperlinks.
- Social traffic: Captures the visitors who land on your site from social media platforms.
- Paid traffic: The number of visitors who come to your site through Google Ads or social media ads.
- Email traffic: The number of visitors who come to your site from links within your email campaigns.
To track your website traffic, you’ll need to invest in a website analytics tool like Google Analytics. All you need to do is set up Google Analytics and add a tracking code to your website. This code will collect all the data about visitors and their activities on your site.
Takeaway
Website traffic is the starting point for measuring your customer engagement. It gives you a fair idea of the visibility and reach of your website, if users aren’t visiting your website, there’s no opportunity for them to engage with your content, products, or services. Conversely, High traffic volumes increase your chances of engaging a broader audience.
2. Session duration
The next important metric to track in your website is the session duration. So, what do you mean by session duration?
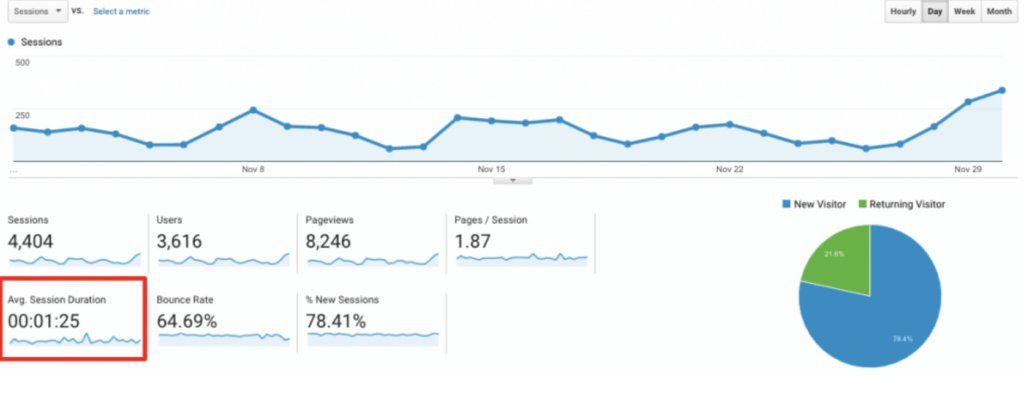
Session duration is the total time a user spends on a particular page of your website during a single visit. It is tracked from the moment they land on your site to when they leave or become inactive.
If you use Google Analytics, you’ll be able to find your average session durations when you check the insights of your website pages.
What do session durations tell you about your website?
- If your website analytics tool shows longer session durations, it means that your users are finding the content engaging and valuable. It means your users are spending time-consuming your content, reading articles, watching videos, or interacting with features.
- On the other hand, a short session duration can indicate that users are not finding what they are looking for or that the content is not engaging enough.
Takeaway
Average session duration is an important metric that shows genuine user engagement. It’s not something you can easily manipulate with ads, keyword stuffing, or catchy headlines. It provides a true measure of how much time visitors are actually spending on your site. This indicates how interested and engaged they are with your content.
Recommended read: 18 Key Customer Service Metrics + How to Use Them
3. Pages per session
Another important website metric that you should be aware of is – pages per session.
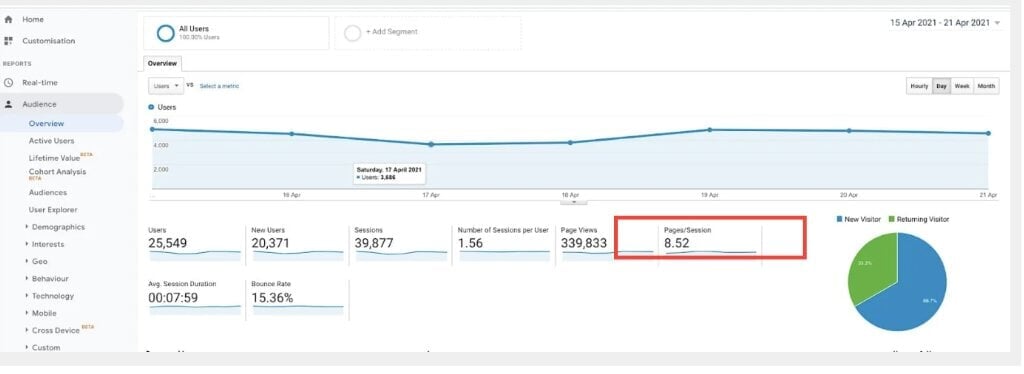
Pages per session is the average number of pages a visitor goes through during a single visit to your website.
It gives you an idea of how much your visitors are exploring about your brand when they come to your site. From the moment a visitor lands on your site to when they leave or become inactive, every page they click counts towards this metric.
You can use any website analytics tool like Google Analytics or Amplitude to track this metric.
So, what do Pages per session tell you about customer engagement?
- High number of pages per session is a great sign! It means users are interested enough in your content and they want to explore more by clicking on other pages. They might be reading blog posts, checking out multiple product pages, or navigating through your service offerings.
- On the flip side, a low number of pages per session might suggest that users aren’t finding what they’re looking for or that your site’s navigation could be improved. It could also mean that the content isn’t compelling enough to keep exploring.
Takeaway
Pages per session is a metric that tells you how users are interacting with your site. It reflects how curious and engaged your visitors are, showing whether they’re just skimming the surface or diving deep into your content. Just like session duration, you cannot manipulate this metric with marketing tricks or flashy headlines. Instead, it gives you a clear picture of the user experience on your site.
4. Bounce rate
Let’s talk about Bounce rate—one of those metrics that often gets overlooked but is quite important for understanding your website’s performance.
Bounce rate is the percentage of visitors who land on a page and then leave without clicking on anything else or visiting another page of your website. So basically, they just “bounce” away after viewing just one page. This could mean they either found what they needed right away, or, they didn’t find what they were looking for and left immediately.
Bounce rate gives you a quick snapshot of how well your website is holding your customers’ attention. If someone lands on your site and leaves almost instantly, it could indicate a few things: maybe your page didn’t load fast enough, the content wasn’t relevant to what they were looking for, or the user experience wasn’t that great.
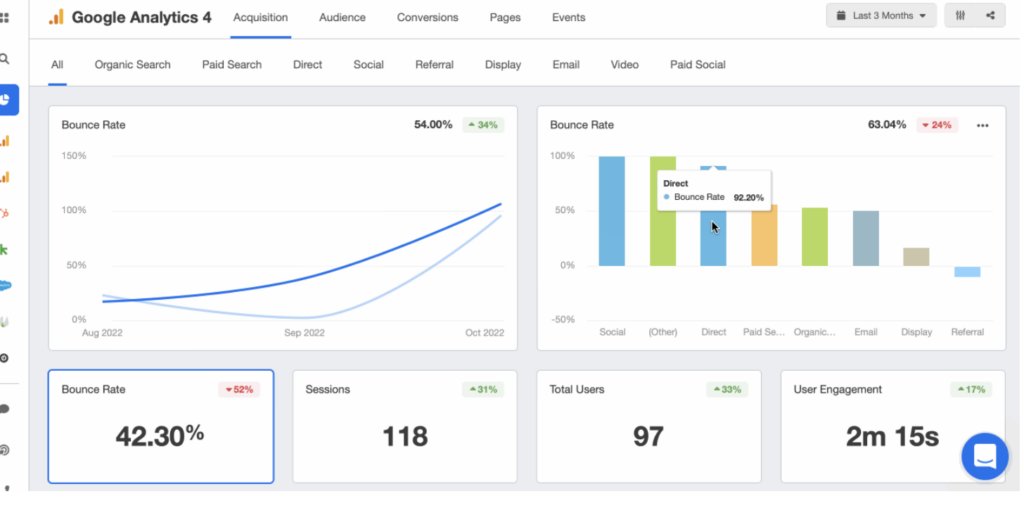
But here’s the thing—bounce rate isn’t always a bad thing. For example, if you have a single-page site or if the goal is to provide a quick answer (like on a blog post),a high bounce rate could mean that the user found exactly what they were looking for and didn’t need additional exploring. It all depends on the context of your website.
Takeaway
So, to sum up:
- A high bounce rate on a landing page or product page might suggest that visitors aren’t finding what they expect or that the content isn’t compelling enough. It could also mean there’s a disconnect between what visitors are searching for and what they’re seeing on your page.
- On the other hand, a low bounce rate indicates that users are engaging deeply with your site by clicking around and exploring other pages.
5. Active user metrics (DAU, MAU)
Active user metrics like Daily Active Users (DAU) and Monthly Active Users (MAU) give you a snapshot of how engaged your customers are with your website on a daily or monthly basis.
To give you an in-depth definition of these two metrics:
Daily Active Users (DAU) measures the number of users who interact with your website on a daily basis. And when you track this metric on a monthly basis, it becomes Monthly Active Users (MAU).
You can track these metrics through most website analytics tools like Google Analytics or app analytics tools like Clevertap or Mixpanel. By closely monitoring these numbers, you’ll be able to see trends and identify spikes or drops in user engagement.
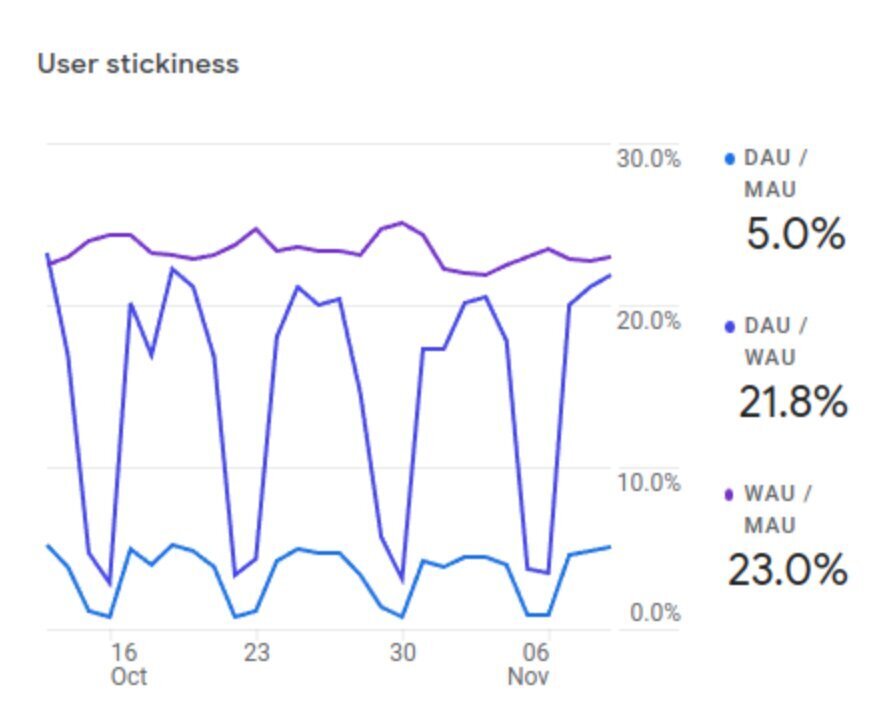
So, what does a high or a low DAU or MAU tell you about your customer engagement?
- If you have high DAU and MAU, it means that your platform is doing a great job of keeping users engaged. People find your content, services, or features valuable enough to come back regularly.
- If you see a low DAU but a high MAU, it might mean that your users find your platform useful but don’t need to interact with it daily. This could be true for certain websites and apps that offer financial services or certain e-commerce sites, where users check in occasionally.
- If both DAU and MAU are low, it might indicate that your site or app isn’t providing enough value for your users to keep coming back. This can indicate that your website or app’s UX, content, or functionality needs improvement.
Takeaway
DAU and MAU are good indicators of user engagement and stickiness. These metrics don’t just tell you how many people are visiting your website or app, but also how many are actually coming back and using it regularly. High DAU and MAU numbers suggest that your platform is providing ongoing value to your customers.
6. Email open rates and CTRs
Email engagement metrics are as important as your website or app analytics. Your digital marketing efforts might also include email marketing campaigns, and it’s important to track their performance. So, if you’re sending cold emails or even newsletters and promotional emails to your prospects or subscribers, you might want to measure their open rates and Click-through rates (CTR).
Let’s understand these two metrics one by one.
Email open rates measure the percentage of recipients who open your email out of the total number of emails sent. It’s a powerful metric that tells you how effective your subject lines are and whether your emails are catching your audience’s attention.
A high open rate indicates that your subject lines are compelling and your audience is looking forward to reading your email content. On the flip side, a low open rate might suggest that your emails are getting lost in your audience’s inbox. It can also imply that your subject lines might need some more thinking to urge your audience to open them.
Click-through rate (CTR) is the percentage of recipients who click on one or more links in your email. This metric goes a step further than the open rate by showing how engaged your audience is with the content of your email.
It’s one thing to get someone to open your email, but getting them to click through to your website, product page, or another piece of content is a stronger indicator of email engagement.
A high CTR means your email content is compelling and relevant, encouraging readers to take action. A low CTR, on the other hand, could mean that your content isn’t connecting with your audience or that your CTA isn’t appealing enough.
You can track these metrics through any email analytics tool like GMass or Mailtracker.

Takeaway
Both open rates and CTRs help you to measure your email marketing efforts. They help you make informed decisions, like optimizing your email campaigns for better results. Tracking these metrics can also help you experiment with different subject lines, email content, and CTAs to see what resonates most with your audience.
7. Conversion rate
Whether you’re running an e-commerce store or a service-based business, your conversion rate is a direct indicator of how well you’re achieving your business goals.
Conversion rate is the percentage of users visiting your website who take a desired action. This action can vary depending on your business objectives. For an online store, a conversion might be a completed purchase. For a SaaS company, it could be signing up for a free trial. For a blog, a conversion might mean subscribing to a newsletter.
Here’s how to calculate the conversion rate for your business:
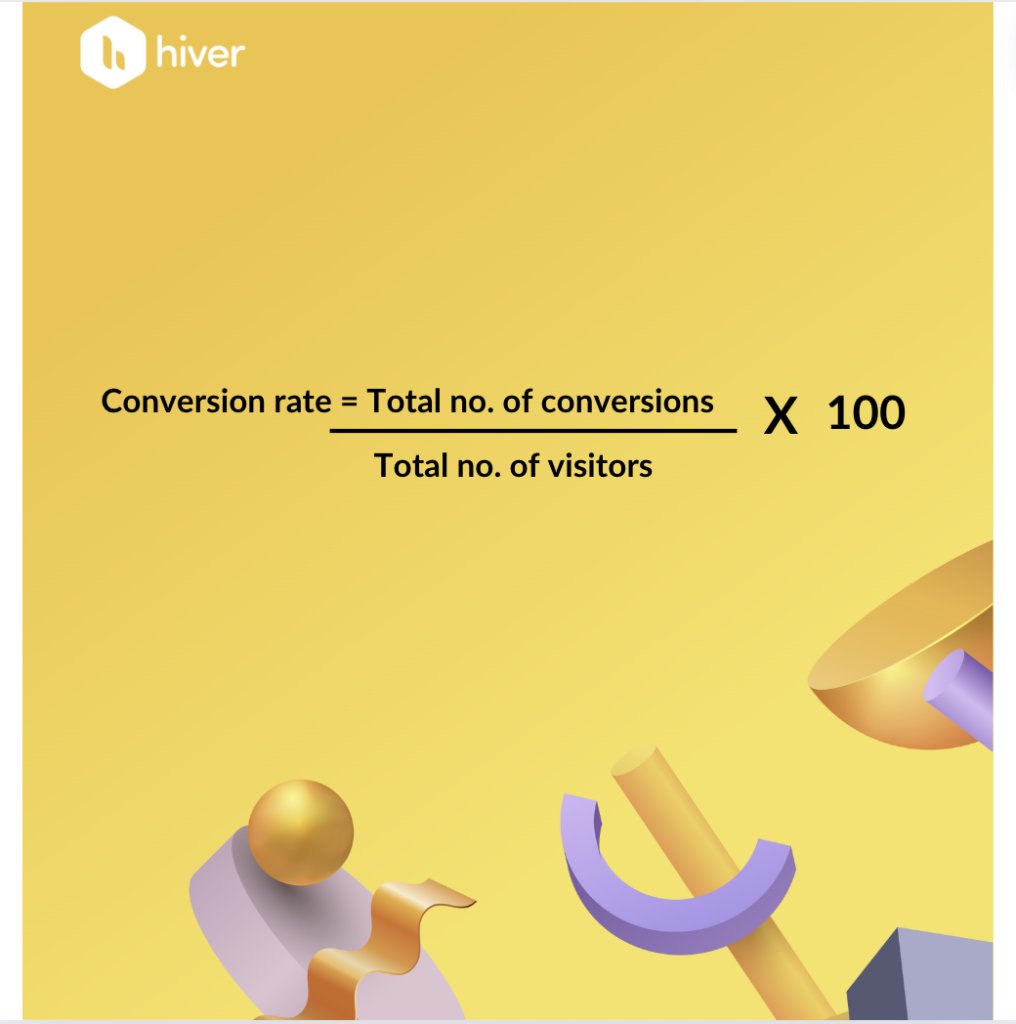
So, what do conversion rates tell you about your business?
- A high conversion rate often indicates that your website is attracting the right audience and that your marketing messages are resonating.
- If your conversion rate is low, it might be a sign that something needs to be optimized. It can be your website’s user experience, the clarity of your call to action, or even your overall value proposition.
Now that you know what conversion rates tell you about your customer engagement, you must be wondering what the ideal rate should be. The truth is, there is no right answer. It really depends on the industry, your business size, and your goals.
Here’s what a Reddit user says when asked what is a good conversion rate:
Takeaway
Conversion rate is one of the most telling metrics for understanding how well your website and marketing efforts are performing. This metric tracks if your customers complete the actions that align with your business goals.
8. Social media metrics
Till now we’ve covered the important metrics to track in channels like website and email. Now let’s move to another important channel: social media. You use social media to engage with your audience, build relationships, and create content that resonates. But how do you track if your social media strategy is working or not? By tracking the right metrics.
Social media metrics are insights that help you measure the performance of your social media efforts. These metrics can tell you everything from how many people are seeing your posts to how engaged your audience is with your content.
Here are some of the metrics that you should keep a tab on:
- Likes, comments, shares, and tweets: These are engagement metrics that measure how much your audience is interacting with your content. A high engagement rate indicates that your content is resonating with your audience.
- Reach and Impressions:Reach refers to the total number of unique users who have seen your content., Impressions measure how many times your content has been displayed, regardless of whether it was clicked on.
- Follower Growth: Tracking how your follower count changes over time can give you insights into your brand’s popularity and visibility.
- Click-Through Rate (CTR): Similar to email CTR, this metric measures the percentage of people who clicked on a link in your social media post or profile. A high CTR indicates that your content is compelling and that your call to action is strong.
Today, most social media channels, such as Facebook, Instagram, and LinkedIn, have built-in analytics and reporting dashboards. These dashboards give a pretty good idea of customer engagement.
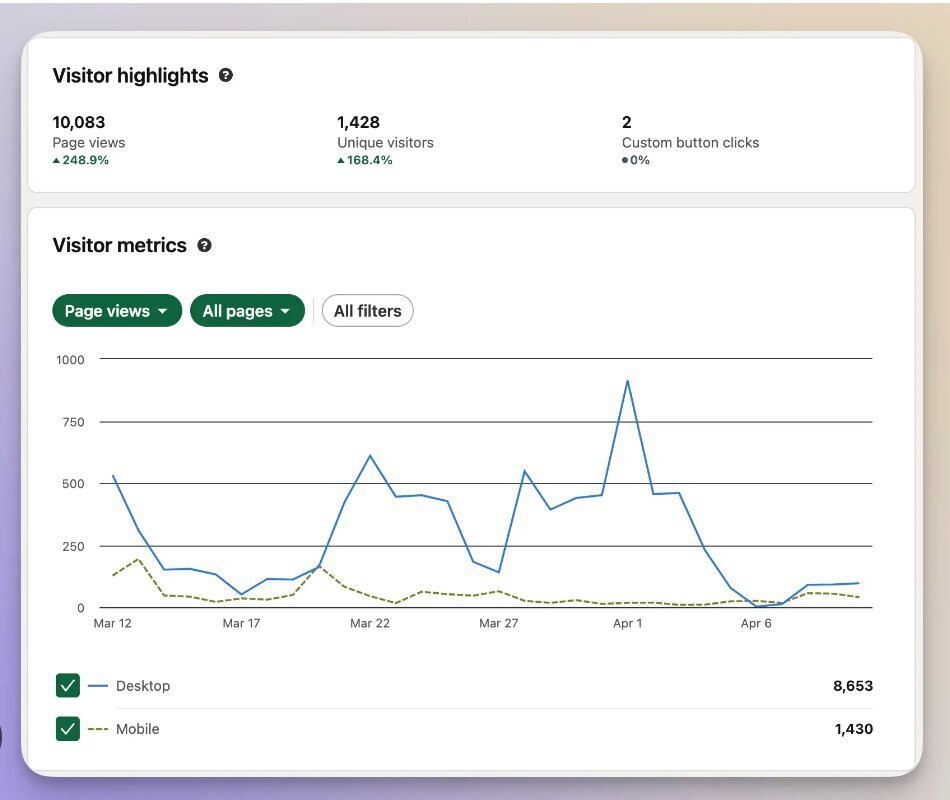
Takeaway
Social media metrics help you gauge your audience’s preferences and behaviors. By tracking these metrics, you can tailor your social media strategy to better meet your audience’s needs and interests and build a stronger online presence for your brand.
Recommended read: Social Media Data Mining to Improve Customer Experience
9. CSAT Score
Another metric that businesses use to gauge how engaged their customers are is Customer Satisfaction (CSAT) score. It’s a direct way to measure short-term satisfaction and pinpoint areas for improvement.
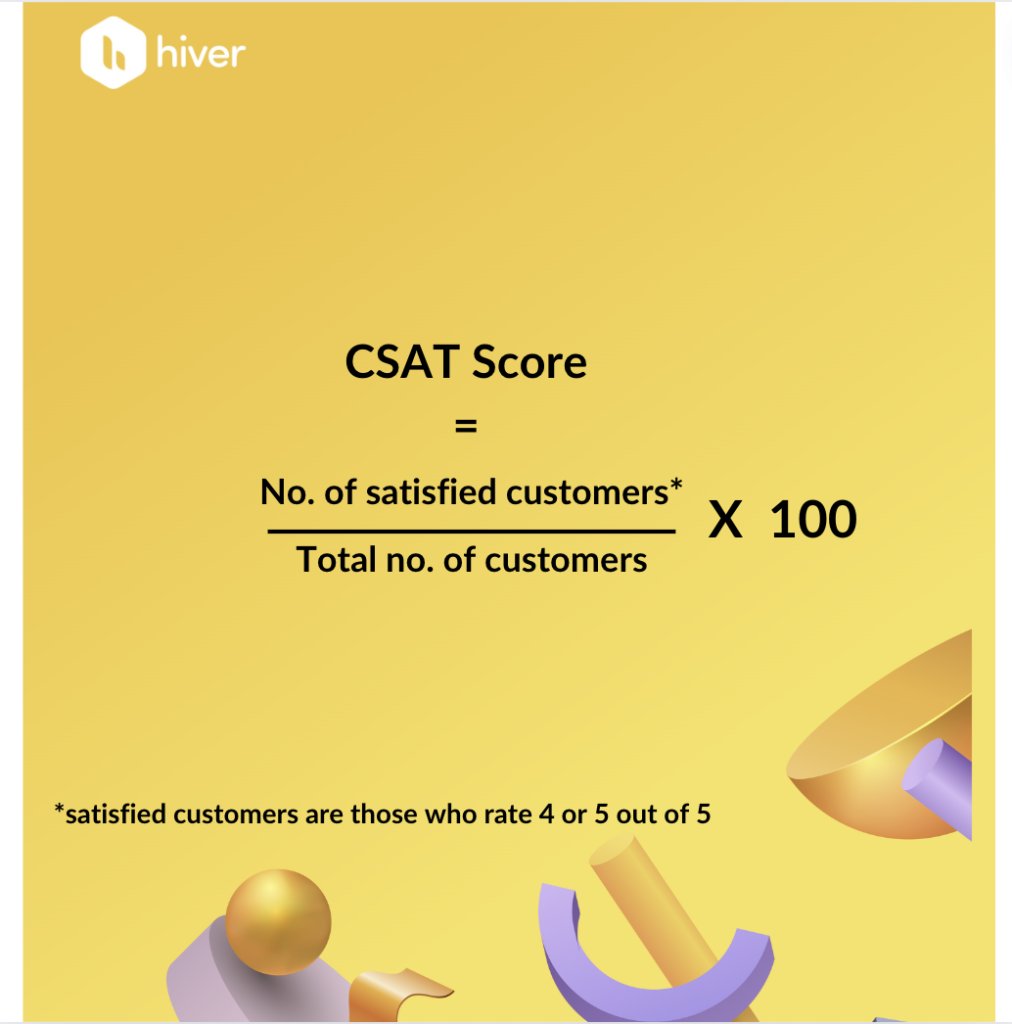
Customer Satisfaction Score (CSAT) measures how satisfied your customers are with your product, service, or a particular interaction. Typically, it involves asking customers, through a survey, to rate their satisfaction on a scale of 1 to 5, with 1 being “Not at all satisfied” and 5 being “very satisfied.”
This survey is usually done after a customer interaction – possibly right after your suppor team resolves a customer query, or after a customer purchases a product from your store.
How to Calculate CSAT Score
Once you gather all the ratings given by your customers, use this formula to find your business CSAT score
How does calculating CSAT score help your business?
- CSAT provides immediate, direct feedback from customers about their satisfaction with a specific product, service, or interaction. This helps you understand what you’re doing well and where there might be room for improvement.
- If a customer rates their experience poorly, you can quickly address their concerns and improve the experience for others.
- By regularly measuring CSAT, you can track how customer satisfaction changes over time in response to your actions.
Takeaway
Customer Satisfaction Score (CSAT) is a valuable metric for gauging how satisfied customers are with specific aspects of your business. It provides direct feedback that you can use to enhance customer experiences, boost satisfaction, and ultimately drive higher engagement.
10. Customer Lifetime Value (CLV)
This metric is all about the long-term value. Unlike other metrics that measure short-term performance or immediate outcomes, CLV helps you understand the overall value a customer brings to your business over the entire duration of their relationship with you.
Customer Lifetime Value (CLV) represents the total amount of revenue you can expect from a single customer account throughout their entire relationship with your business.
This metric includes not just one purchase but every purchase a customer makes—from the first to the last—including any recurring revenue in the form of subscriptions or repeat purchases.
There are several ways to calculate CLV, but the simplest formula is:
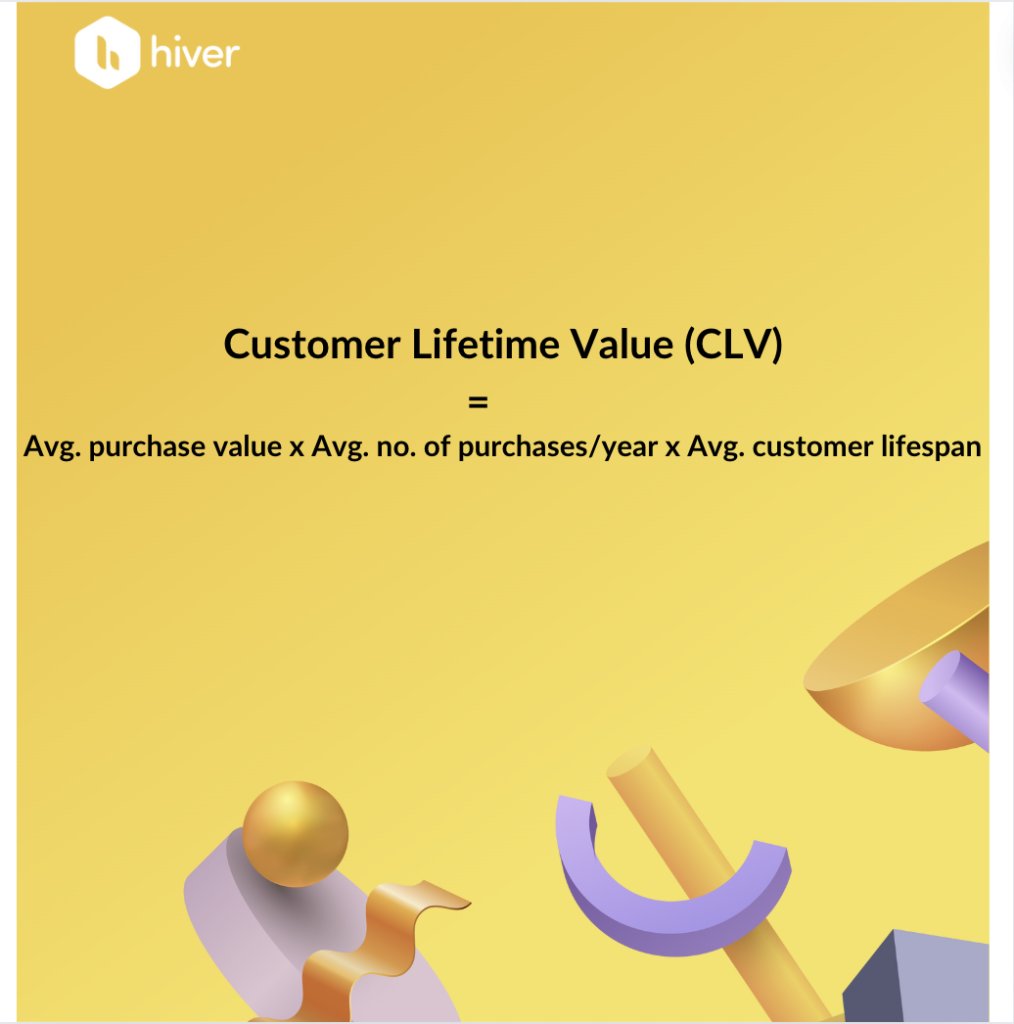
So, for example, if we assume the following inputs:
Average Purchase Value: $50
Average Number of Purchases per Year: 5
Average Customer Lifespan: 3 years
So, CLV = $50 * 5 * 3 = $750
This means that, on average, each customer brings $750 in revenue over their entire relationship with your business.
Takeaway
Customer lifetime value (CLV) is a metric used to understand the long-term value of your customers. It’s not just about how much a customer spends in one transaction but how much they’re worth over the entire time they’re with your company. By focusing on increasing CLV, you’re not only improving your revenue but also building stronger, more loyal relationships with your customers.
Recommended read: Top 17 Customer Success Metrics & How to Track Them
11. Net Promoter Score
Net Promoter Score (NPS),is a popular metric to measure customer loyalty and satisfaction. NPS is unique because it focuses not just on what customers are currently doing, but on how likely they are to recommend your business to others—an indicator of long-term satisfaction and brand advocacy.
Net Promoter Score (NPS) is a customer loyalty metric that gauges how likely your customers are to recommend your product, service, or brand to others.
The NPS survey usually consists of a single, simple question: “On a scale of 0 to 10, how likely are you to recommend our company to a friend or colleague? 0 being least likely and 10 being most likely.”
The customers are then classified into 3 groups based on their responses.
- Promoters (customers who rate 9-10): These are your most loyal and enthusiastic customers. They love what you offer and are likely to recommend your brand to others.
- Passives (customers who rates 7-8): They are satisfied but not particularly enthusiastic. They might be happy with your service or product but aren’t likely to go out of their way to recommend you to others. These customers are also at risk of switching to a competitor if offered a better deal.
- Detractors (customer who rate 0-6): They are unhappy and could potentially damage your brand through negative word-of-mouth. They are unlikely to purchase again and might discourage others from doing so.
Based on your classification, here’s how you calculate NPS:

For example, after conducting an NPS survey, you find you have 60% promoters, 25% passives and 15% detractors.
So your NPS score would be = 45%
Now, you may ask what is a good NPS score? Although it may vary from one industry to another, in general, according to Bain and Company,
- Above 0 is good
- Above 20 is favorable
- Above 50 is excellent
- Above 80 is world-class
Here’s why you should measure NPS to gauge customer engagement:
- Captures your customer’s emotional engagement – When customers rate how likely they are to recommend your business to others, they’re reflecting their overall experience and satisfaction. This level of emotional commitment is a strong signal of engagement because engaged customers are more likely to feel positively about your brand and promote it within their circles.
- Identifies touchpoints and pain points – NPS surveys often include a follow-up question asking customers to explain their score. This qualitative data can provide insights into which aspects of your business are driving engagement and which areas may need improvement.
- Tracks customer engagement over time –. An increasing NPS score over time suggests that your customer engagement efforts are paying off and that more customers are becoming promoters. A declining NPS might indicate disengagement or dissatisfaction. This means you might need to review and improve your customer experience strategies.
Takeaway
Net Promoter Score (NPS) is a valuable metric for measuring customer engagement because it captures the depth of a customer’s relationship with your brand. It reveals not just how satisfied customers are, but how committed they are to supporting and advocating for your business.
Improve Customer Engagement By Tracking The Right Metrics
We hope that by tracking these top customer engagement metrics you’ll be able to gain valuable insights on your customer behaviour, preference and overall satisfaction. Please bear in mind that the metrics you track should align with your business goals and the strategies you implement to improve your customer engagement. So feel free to pick and choose the metrics that matters the most.
Remember, it’s not just about collecting data—it’s about understanding the insights you get from them and how you use them to create meaningful customer interactions – right from when your customer discovers your brand, makes a purchase and reaches out to you for customer support. The right tools and strategies can make all the difference in building stronger, more loyal customer relationships.
Speaking of customer support, you might want to check out Hiver to streamline your support operations. With Hiver, you can manage customer queries directly from your inbox, ensuring timely and efficient responses that enhance customer satisfaction.
Want to check out more? Start a free trial
Frequently Asked Questions (FAQs)
- What are customer engagement metrics?
These are data points that help you understand how customers are interacting with your brand. These metrics provide insights into your customers’ behavior, preferences, and level of satisfaction with your products or services.
- Why is tracking customer engagement metrics important?
It is important because it helps you understand your customers better, tailor your strategies to meet their needs, and improve overall satisfaction.
- How can I improve my website’s bounce rate?
- Ensure that your website loads quickly is easy to navigate, and provides relevant and quality content for your visitors.
- Make sure your landing pages are aligned with your marketing messages and have simple yet powerful calls to action.
- Regularly analyze your bounce rate and test different elements to improve your website experience.
- How can tracking Customer Lifetime Value (CLV) benefit my business?
Customer Lifetime Value (CLV) helps you understand the total revenue you can expect from a single customer over the duration of their relationship with your business. By tracking this metric, you can implement customer retention strategies to potentially increase your business’s CLV.


