Customers today have an overwhelming amount of choice when it comes to where they spend their money and time. Providing superior customer service hence becomes absolutely critical in order to set yourself apart in a crowded marketplace.
But what does superb customer service look like? How do you ascertain if your customer service quality is at par, if not better than your competitors? It’s impossible to know unless you have substantial data to compare your support performance and quality against. That’s why benchmark statistics are important to have — they give you an idea of what “good” looks like in terms of servicing customers, and help gauge your goals and performance in context with industry standards.
For our first-ever Customer Service Benchmark Report, we surveyed 500 US-based customer service professionals across industry and company sizes to understand how they deliver customer service, and how they track their support performance and quality.
Key findings from Hiver’s research study: Customer Service Benchmark Report – 2021
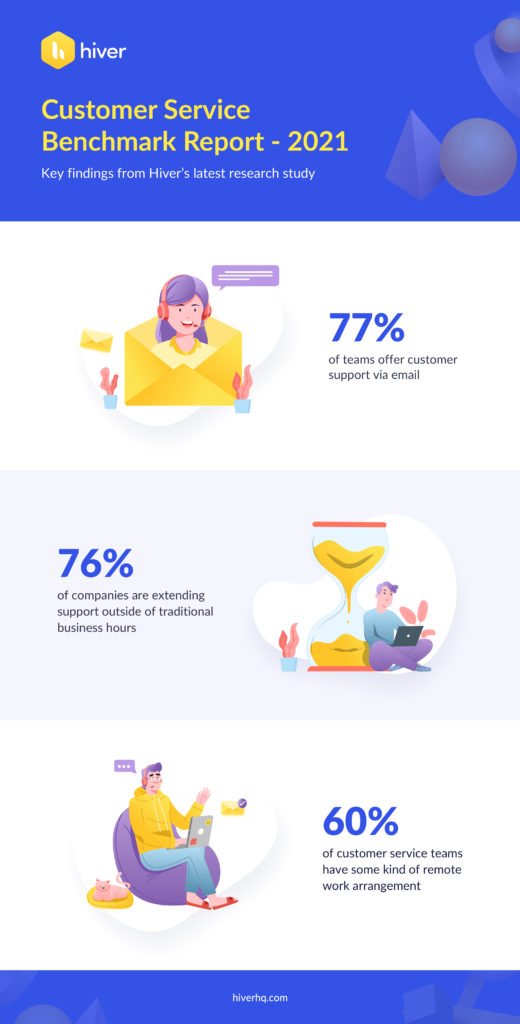
One of the most interesting findings was that a lot of companies are offering customer support above and beyond the standard 9-5 on weekdays. This clearly shows that customers have high expectations and they want to be able to interact with brands at their convenience.
Owing to the pandemic, we’re also seeing more and more customer support teams work remotely
- 77% of teams offer customer support via email.
- 76% of companies are extending support outside of traditional business hours.
- 60% of customer service teams have some kind of remote work arrangement.

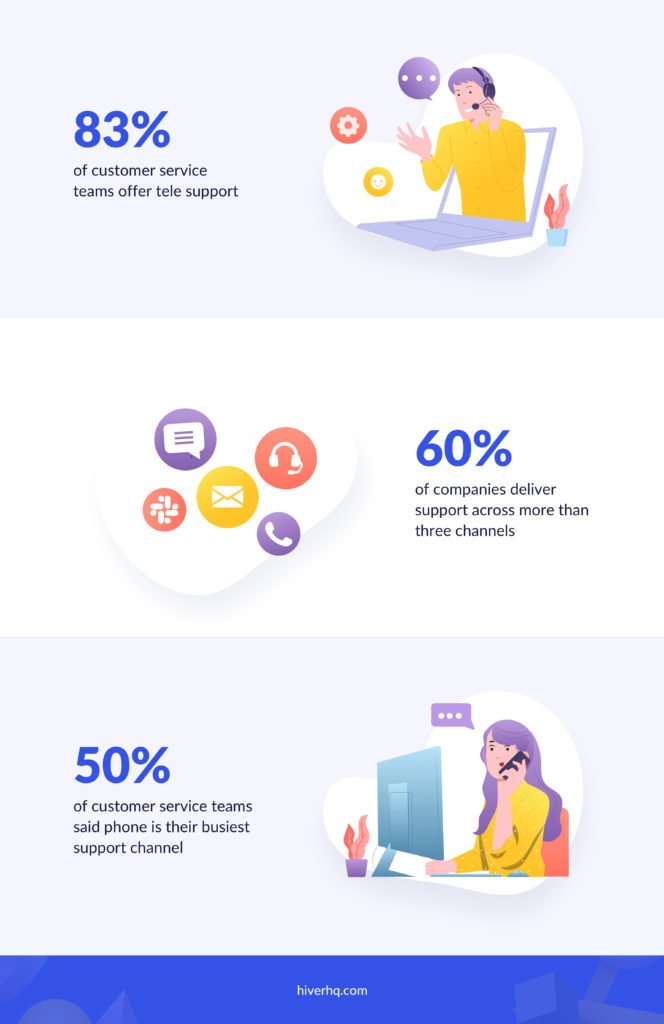
We observed that brands are doing their best to serve modern-day multi-channel customers. Why is this important? Owing to the digital boom, customers have expanded the ways in which they interact with brands. That makes it essential for any brand to have a presence across multiple touchpoints.
- 83% of customer service teams offer tele support.
- 60% of companies deliver support across more than 3 channels.
- 50% of customer service teams said phone is their busiest support channel

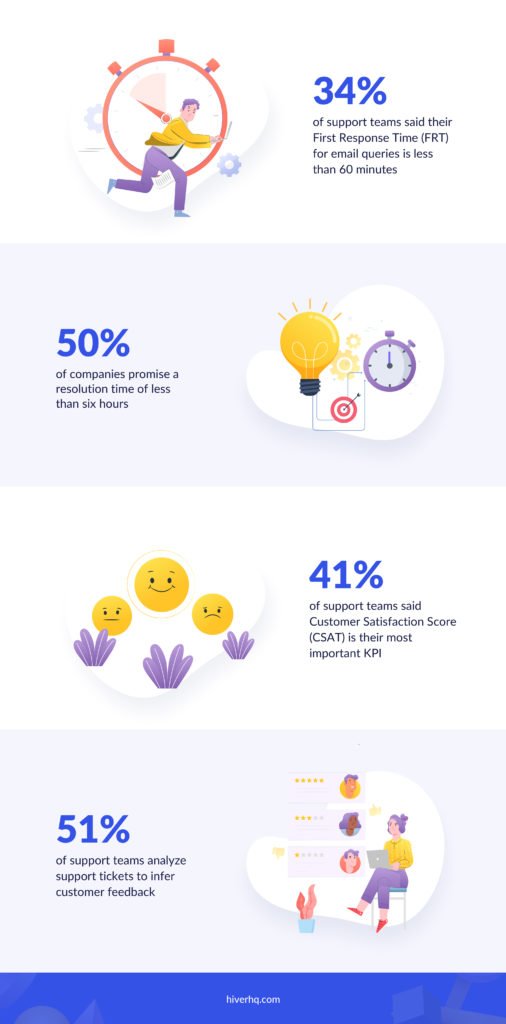
Speed of service is a HUGE differentiator today. From our research, we can safely conclude that brands are prioritizing how quickly they respond to and resolve queries. If you can find ways to minimize waiting time, reduce resolution time, and lower customer effort, you hold an edge over your competition.
Moreover, we found that many support teams don’t just act on customer queries and file them away but use them to infer feedback.
- 34% of support teams said their First Response Time (FRT) for email queries is less than 1 hour.
- 50% of companies promise a resolution time of below 6 hours.
- 41% of support teams said Customer Satisfaction Score (CSAT) is their most important KPI.
- 51% of support teams analyze support tickets to infer customer feedback.


